Products You May Like
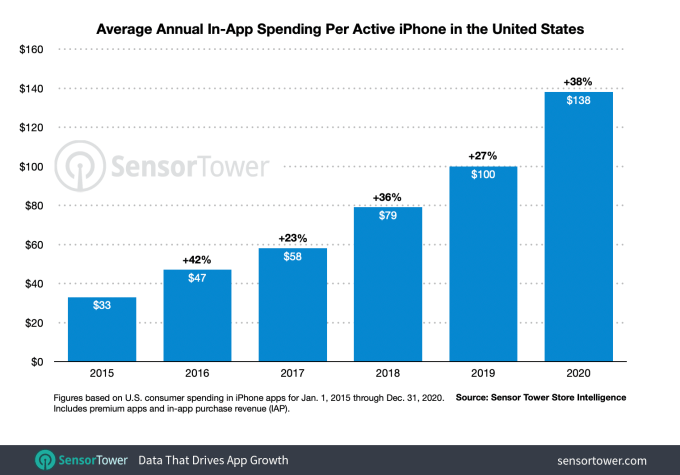
U.S. consumers spent an average of $138 on iPhone apps last year, an increase of 38% year-over-year, largely driven by the pandemic impacts, according to new data from app store intelligence firm Sensor Tower. Throughout 2020, consumers turned to iPhone apps for work, school, entertainment, shopping, and more, driving per-user spending to a new record and the greatest annual growth since 2016, when it had then popped by 42% year-over-year.
Sensor Tower tells TechCrunch it expects the trend of increased consumer spend to continue in 2021, when it projects consumer spend per active iPhone in the U.S. to reach an average of $180. This will again be tied, at least in part, to the lift caused by the pandemic — and, particularly, the lift in pandemic-fueled spending on mobile games.

Image Credits: Sensor Tower
Last year’s increased spending on iPhone apps in the U.S. mirrored global trends, which saw consumers spend a record $111 billion on both iOS and Android apps, per Sensor Tower, and $143 billion, per App Annie, whose analysis had also included some third-party Android app stores in China.
In terms of where U.S. iPhone consumer spending was focused in 2020, the largest category was, of course, gaming.
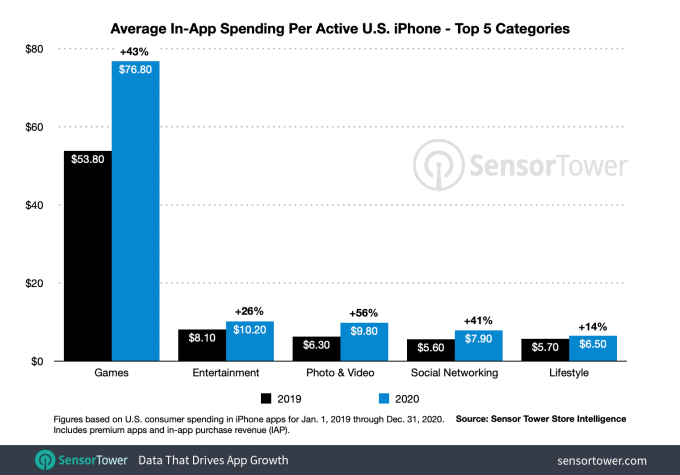
In the U.S., per-device spending on mobile games grew 43% year-over-year from $53.80 in 2019 to $76.80 in 2020. That’s more than 20 points higher than the 22% growth seend between 2018 and 2019, when in-game spending grew from $44 to $53.80.
U.S. users spent the most money on puzzle games, like Candy Crush Saga and Gardenscapes, which may have helped to take people’s minds off the pandemic and its related stresses. That category averaged $15.50 per active iPhone, followed by casino games, which averaged $13.10, and was driven by physical casinos closures. Strategy games also saw a surge in spending in 2020, growing to an average of $12.30 per iPhone user spending.

Image Credits: Sensor Tower
Another big category for in-app spending was Entertainment. With theaters and concerts shut down, consumers turned to streaming apps in larger numbers. Disney+ had launched in late 2019, just months ahead of the pandemic lockdowns and HBO Max soon followed in May 2020.
Average per-device spending in this category was second-highest, at $10.20, up 26% from the $8.10 spent in 2019. For comparison, per-device spending had only grown by 1% between 2018 and 2019.
Other categories in the top five by per-device spending included Photo & Video (up 56% to $9.80), Social Networking (up 41% to $7.90) and Lifestyle (up 14% to $6.50).
These increases were tied to apps like TikTok, YouTube, and Twitch — the latter which saw 680% year-over-year revenue growth in 2020 on U.S. iPhones, specifically. TikTok, meanwhile, saw 140% growth. In the Lifestyle category, dating apps were driving growth as consumers looked to connect with others virtually during lockdowns, while bars and clubs were closed.
Overall, what made 2020 unique was not necessarily what apps people where using, but how often they were being used and how much was being spent.
App Annie had earlier pointed out that the pandemic accelerated mobile adoption by two to three years’ time. And Sensor Tower today tells us that the industry didn’t see the same sort of “seasonality” around spending in certain types of apps, and particularly games, last year — even though, pre-pandemic, there are typically slower parts of the year for spending. That was not the case in 2020, when any time was a good time to spend on apps.